Machine Learning-Driven Analysis of Small Signaling Peptides in Plants
Prediction

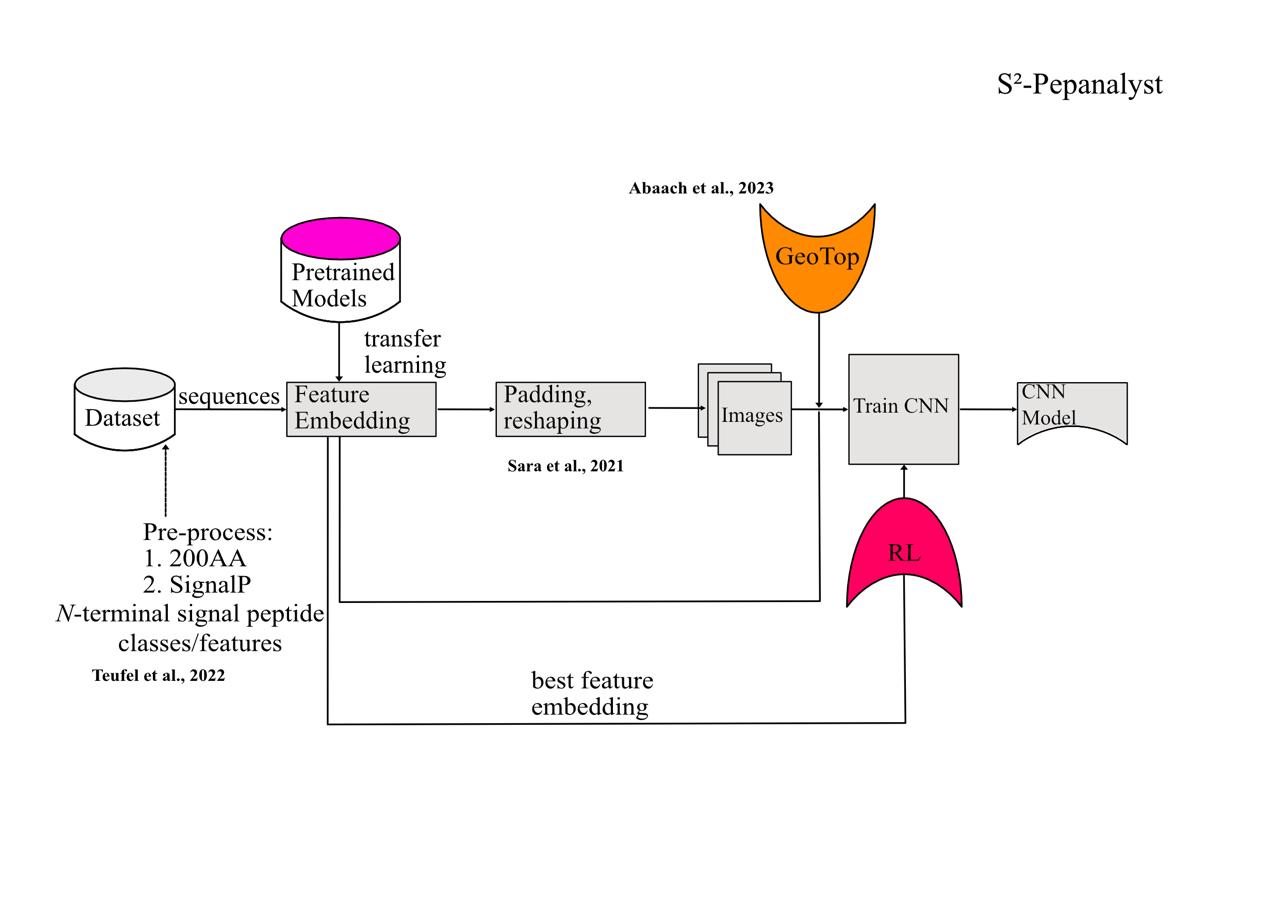
This website provides a comprehensive platform for predicting small signaling peptides (SSPs) in key plant species, including tomato (Solanum lycopersicum), avocado cultivars (Hass and Gwen), and the model organism Arabidopsis thaliana. The tool, S²-PepAnalyst, integrates state-of-the-art machine learning techniques to overcome traditional limitations in SSP prediction, such as reliance on canonical signal peptides.
Key Innovations
Performance and Applications
S²-PepAnalyst outperforms existing tools (e.g., SignalP 6.0 + downstream complementary computational analysis) with 99.5% accuracy, validated across curated and generalized datasets. It addresses critical challenges in plant biology, such as identifying non-canonical peptides (e.g., PEP1) and classifying peptide families (CLE, RALF, etc.). The tool's architecture leverages RL to dynamically refine predictions, ensuring adaptability to novel peptide discovery.
Classification
The other part of this work focuses on classifying small peptides from different signalling families. The methodology employed consists of:
- A comprehensive literature compilation covering all known signalling peptide families from Arabidopsis thaliana (i.e., CEP, CRPs, SCOOPs, RALFs, etc.), along with newly identified signalling peptides, which were incorporated into these families through data mining in well-established databases, including NCBI.
- Construct the geometric representation, in 768 dimensions for TAPE and more for ESM, of each protein sequence i to obtain a finite set of points Xi.
- Compute the persistence diagrams of the sets Xi to obtain the persistence diagrams for dimensions 0, 1, and 2, denoted as PD0,1,2(Xi). This feature also facilitates the identification of behavioural peptides that lack a signal peptide region, such as PEP1, and potentially others.
- Calculate the distance matrix of dimensions n x n, where the entry (i, j) is the Wasserstein distance W0 between the persistence diagrams of dimension 0, W0(PD0(Xi), PD0(Xj)).
- Thus, if such a distance in Step 4 is null for a given pair, this is akin to using BLAST but invariant to changes of scale. Scale invariance helps in detecting functional domains accurately, regardless of their length, leading to better functional annotation of proteins.

